
Last Updated on April 29, 2025 by XAM CONTENT
Hello students, we are providing case study questions for class 6 maths. Case study questions are the new question format that is introduced in CBSE board. The resources for case study questions are very less. So, to help students we have created chapterwise case study questions for class 6 maths. In this article, you will find case study questions for CBSE Class 6 Maths Chapter 4 Data Handling and Presentation. It is a part of Case Study Questions for CBSE Class 6 Maths Series.
| Chapter | Data Handling and Presentation |
| Type of Questions | Case Study Questions |
| Nature of Questions | Competency Based Questions |
| Board | CBSE |
| Class | 6 |
| Subject | Maths |
| Useful for | Class 6 Studying Students |
| Answers provided | Yes |
| Difficulty level | Mentioned |
| Important Link | Class 6 Maths Chapterwise Case Study |
Table of Contents
Case Study Questions on Data Handling and Presentation
Questions
Passage 1: Shobhit works in a shoe store. He records the shoe sizes and the number of pairs sold every day. On Tuesday, he sold 60 pairs. His record for the day is shown below.
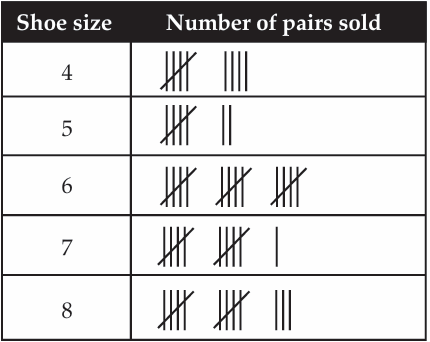
Q. 1. How many pairs of size 8 were sold on Tuesday?
(a) 3
(b) 10
(c) 11
(d) 13
Ans. Option (d) is correct.
Explanation: 13 pair of shoes of size 8 were sold on Tuesday.
Q. 2. Which shoe size sold the most?
(a) Size 4
(b) Size 6
(c) Size 8
(d) Size 9
Ans. Option (b) is correct.
Explanation: Shoe size 6 sold the most for 15 times.
Q. 3. Shobit realised that he had not fully recorded the sale for Tuesday. How many sold pairs had he not recorded?
Sol. 5 pairs
Q. 4. The unrecorded data was of shoe size 7. Shobit corrected his record accordingly. Which of the following statements will be true now?
(a) Shoe size 8 sold the least now
(b) Shoe size 7 sold the most now
(c) Shoe size 5 is the new mode of the data
(d) Number of shoe pairs of size 3 can be calculated
Ans. Option (b) is correct.
Explanation: On making correction, shoe size 7 sold 16 times.
Q. 5. The price of one shoe pair of size 5 is 800. How much money had Shobhit collected by selling all the shoe pairs of size 5?
Sol. ₹5600 (800 × 7 = 5600)
Also check
- Patterns in Mathematics Class 6 Case Study Questions Maths Chapter 1
- Lines and Angles Class 6 Case Study Questions Maths Chapter 2
- Number play Class 6 Case Study Questions Maths Chapter 3
- Data Handling and Presentation Class 6 Case Study Questions Maths Chapter 4
- Prime Time Class 6 Case Study Questions Maths Chapter 5
- Perimeter and Area Class 6 Case Study Questions Maths Chapter 6
- Fractions Class 6 Case Study Questions Maths Chapter 7
- Playing with Construction Class 6 Case Study Questions Maths Chapter 8
- Symmetry Class 6 Case Study Questions Maths Chapter 9
- The Other Side of Zero Class 6 Case Study Questions Maths Chapter 10
🚀 Boost Your Exam Prep: Get case study questions for all subjects (Class 6-12) now!
👉 Explore more resources on CBSE Class 6
Topics from which case study questions may be asked
- Recording Data
- Organisation of Data
- Pictograph
- Bar graph
Case study questions from the above given topic may be asked.
Learning Outcomes
- Recording data as a list.
- Organisation of data in tabular form.
- Able to understand the language skills related to data handling.
- Able to understand the various methods for representing data visually.
🔗👉 Read Also: NCERT Solutions for Class 1 to 12
Understanding Data Handling and Presentation
- Data is information in numbers collected for a specific purpose.
- The collected data is recorded either as hard copy or soft copy. This data is also called as raw data.
- When raw data is arranged in a systematic way in a table, the data is said to be organised.
- Representing the given data in the form of pictures is called pictograph.
- Interpretation of pictograph involves studying the pictures and deducing the required information.
Recording Data
Data is information in numbers collected for a specific purpose. For example, marks of the students in a class and rainfall for a month in a particular place. This information is collected and recorded as Raw data. Raw data also refers to data collected from a primary source.
Examples:
- Grades of 10 students in a class are – A, A, B, C, C, A, B, B, B, C.
- Runs scored by a team in a series – 200, 107, 115, 99, 190.
- Temperature of 7 cities on a particular day – 12°C, 20°C, 30°C, 35°C, 41°C, 10°C, 37°C.
- Information collected as numbers is called raw data.
- Raw data is collected from a primary source
Frequently Asked Questions (FAQs) on Data Handling and Presentation Case Study
Q1: What is Data Handling in Mathematics?
A1: Data handling refers to the process of collecting, organizing, and representing data in a way that is easy to understand and interpret. It helps in analyzing and making sense of the data to draw conclusions.
Q2: What are the different ways to represent data?
A2: The different ways to represent data include:
Pictographs: Using pictures or symbols to represent data.
Bar Graphs: Using bars of equal width to show quantities.
Tally Marks: Using grouped vertical lines to count items.
Tables: Organizing data in rows and columns.
Q3: What are tally marks, and how are they used?
A3: Tally marks are a quick way of counting objects using vertical lines. Every fifth tally is represented as a diagonal line crossing four vertical lines to form a group of five. Tally marks are used to count and organize data efficiently.
Q4: What is a Pictograph? How is it useful?
A4: A pictograph uses pictures or symbols to represent data. Each symbol represents a certain number of items.
Example: 🍎 = 5 apples.
It is useful because it makes the data visually appealing and easier to interpret, especially for younger students.
Q5: What is a bar graph, and how is it constructed?
A5: A bar graph is a chart that represents data using rectangular bars of equal width.
To construct a bar graph:Draw two axes (x-axis and y-axis).
Label the axes (e.g., categories on x-axis and values on y-axis).
Choose a scale for the y-axis.
Draw bars for each category according to the given data.
Q6: How do you interpret data from a bar graph?
A6: To interpret data from a bar graph:
Look at the labels on the x-axis and y-axis to understand what the graph represents.
Check the height of the bars to determine the value or frequency of each category.
Compare the heights of the bars to analyze trends or make comparisons.
Q7: What is the difference between raw data and organized data?
A7: Raw Data: Data in its original, unorganized form (e.g., 5, 7, 9, 2, 5, 7).
Organized Data: Data that has been arranged in a specific order or format, such as in a table or using tally marks.
Q8: Why is data handling important?
A8: Data handling is important because:
It helps in organizing large amounts of information.
It allows for better understanding and analysis of data.
It aids in making informed decisions based on the data.
Q9: What are the key points to remember when drawing a bar graph?
A9: When drawing a bar graph, remember:
Use equal spacing between bars.
All bars should have the same width.
Label the axes clearly.
Choose an appropriate scale for the y-axis.
Use a ruler for neatness and accuracy.
Q10: Can you give a real-life example of data handling?
A10: Yes, here’s a real-life example:
Counting the number of different fruits sold in a shop in a week.
Organizing the data in a table.
Representing the data using a pictograph or bar graph to compare the sales.
Q14: Are there any online resources or tools available for practicing “Data Handling and Presentation” case study questions?
A14: We provide case study questions for CBSE Class 6 Maths on our website. Students can visit the website and practice sufficient case study questions and prepare for their exams. If you need more case study questions, then you can visit Physics Gurukul website. they are having a large collection of case study questions for all classes.